
|
 |
|
{Page 57}
Department of Forestry, Oklahoma State University, Stillwater, OK 74078
Department of Forestry, Oklahoma State University, Stillwater, OK 74078
Department of Plant and Soil Sciences, Oklahoma State University, Stillwater, OK 74078
1Current address: Oklahoma Arts Council, Oklahoma City, OK 73152
2Current address: Tall Timbers Research Station, Tallahassee, FL 32312
We evaluated the presettlement landscape structure and composition along the North Canadian River riparian corridor in central Oklahoma and measured landscape change over the past century. The presettlement (1872) landscape of the riparian corridor was composed of a low density Populus deltoides dominated forest community with Quercus stellata and Q. marilandica the dominant tree species in the uplands. The surrounding matrix was rolling prairie. Major changes through time have been the result of human development, agriculture, urbanization, and river impoundments. The North Canadian River has been reduced in breadth by 75% and is much straighter. Approximately 98% of the 1872 rangeland was replaced by other land uses, mostly agriculture. Forested land decreased 71% by 1941 and another 27% from 1941 to 1991. Urban land use had increased more than 20-fold by 1941. Mean patch size for the entire study area decreased approximately 94% by 1941. Landscape diversity and evenness steadily increased through time as a result of landscape fragmentation. Although the riparian corridor has been greatly altered, reconstruction of the riparian corridor would serve to restore an ecologically valuable community having benefits for both wildlife and humans, such as habitat, water purification, aesthetics, and recreation.© 2002 Oklahoma Academy of Science
| Introduction | Materials and Methods | Results | Discussion | References | Top of Page | Table of Contents | Home |
At the time of colonial settlement, the United States had an estimated 87 million ha of wetlands. Only half of that amount remains today. Between the mid-1950s and mid-1970s, an annual average of 185,490 ha of wetlands was lost mainly to drainage for agriculture and some for urban development (1). At that time, wetlands were perceived as being of little practical use (2). Over 80% of riparian corridors in North America and Europe have disappeared during the last two centuries (3). Only 15% of the bottomland hardwoods in eastern Oklahoma that existed before European settlement remain today (4). In western Oklahoma only 3% of the historic riparian habitat remains. Currently, 21.6% to 27.7% of that area is forested (5).
Wetlands, especially riparian corridors, have been recognized for their high bio-diversity, flood and erosion control, water purification, wildlife habitats, and recreational and aesthetic values (2,3,6-8). Despite these benefits, modification to these wetlands continues with little attention given to the possible consequences. Alteration of the landscape greatly affects movement of water, sediment, and woody debris, which in turn affects the characteristics of riparian corridors (3).
Riparian corridors should be protected and used in water and landscape planning
{Page 58}
because of the associated diversity of landforms and wildlife (3). However, decisions in planning are often based only on water-related or fisheries criteria (9,10). Strategies should address the habitat requirements of terrestrial plant and animal species that use riparian corridors as routes for movement across the landscape. Some species require the wet environment of flood plains, whereas others require an upland community structure (6). Therefore, to accomplish riparian conservation or restoration goals, projects should cover associated uplands as well as flood plains (6,10).
Without fully understanding the function of riparian corridors in a landscape, land managers often promote the inclusion of corridors in the landscape to connect patches of isolated habitat. This may increase expansion and genetic mixing of populations and may raise local species richness. However, many native species found in isolated habitats may not travel along connecting riparian corridors (11). Instead of providing new sources of habitat for target species, at a larger scale, riparian corridors may increase the occurrence of alien or adventive species that outcompete and alter the integrity of local communities within connected habitats or regions (12,13). For example, according to Knopf (11), riparian corridor reforestation in the Great Plains region confounds the conservation of native species in the region because forested riparian corridors did not historically link distant patches of habitats. Before plans are made for the inclusion or conservation of a riparian corridor, it is important to know if the vegetation associations are native or are introduced and to know the historical connectivity context. Therefore, baseline or historic conditions must be defined (13). This will reduce the likelihood of compromising the integrity of a region's bio-diversity (11,14).
To reconstruct riparian landscapes to historic conditions a description of presettlement landscape structure and composition is essential. This description provides a baseline for setting restoration goals (15,16). For landscape restoration, historical land use records, such as the General Land Office (GLO) survey notes, have been essential sources for pre-settlement information (17-19). The GLO oversaw carrying out the Public Land Survey, which was based on the Land Ordinance of 1785. This ordinance established the rectangular system of survey (township, range and section) as the standard to expedite the sale of land (19). Surveyors were required to describe the landscape and survey route in several capacities. For each township, a general description of the dominant vegetation (timber type or prairie) was given. At each section corner and quarter-section corner, witness trees were identified and the species, diameter, distance and azimuth were recorded. Two bearing trees were identified at each quarter-section corner and four at each section corner in each adjoining section. Trees that occurred on the line were recorded as well (18,19). In some areas, reference was made to ground level vegetation. Although these data were not collected for ecological reasons, their use provides valuable insight into presettlement conditions (19).
The method of tree selection by the surveyor has significant implications on reconstruction of presettlement tree densities. Surveyors were instructed to select trees that were the soundest in appearance, of good size and type that were most likely to be permanent and lasting (15-19). Trees selected by the surveyor were not always the nearest to the corner post and, therefore, the tree-to-post measurements used in point-quarter sample analysis are biased. This bias would then create an underestimation of true presettlement tree density estimates. As a result, the reconstruction may not reflect absolute densities, but the estimates do provide data for relative comparisons (17).
The objective of this study was to describe presettlement landscape structure and composition along a central Oklahoma riparian corridor. We also sought to determine whether or not a forested riparian corridor existed prior to European settlement and, if so, characterize its composition and approximate structure. We measured the degree of landscape change
{Page 59}
that has occurred over the past century. Furthermore, data from this study will serve as a baseline for possible future land use planning and habitat restoration of central Oklahoma riparian corridors.
| Introduction | Materials and Methods | Results | Discussion | References | Top of Page | Table of Contents | Home |
Study Area. Our study area was centered along approximately 48 km of the North Canadian River in eastern Canadian County and continuing into western Oklahoma County in central Oklahoma. We focused on a 1.61-km buffer on either side of the river to encompass both the riparian corridor surrounding the river and the surrounding matrix of prairie vegetation. The North Canadian River flows across New Mexico, Oklahoma, and Texas with approximately 61.3% of the drainage area situated in Oklahoma (20).
The study area boundary begins at the river intersection with the public land survey (PLS) line between sections 9 and 10 of township 12 north, range 6 west based on the 1991 river position. The study area ends at the river's intersection at the boundary of sections 9 and 10 of township 11 north, range 3 west. Along both sides of the river, the 1.61-km buffer radius establishes north and south boundaries. We chose to buffer the river because riverbanks have moved considerably through time; therefore, the north and south boundaries of the study area were not constant throughout the study. The east and west boundaries were constant.
Lake Overholser, located in western Oklahoma City, divides the study area into east and west sections. The western half of the study area, upstream from Overholser, and the eastern half, downstream, belong to two separate sub-basins. Annual precipitation in the sub-basin including Lake Overholser and continuing upstream to the Canton Lake Reservoir is 73 cm. Downstream of Lake Overholser in the eastern sub-basin the annual precipitation is 95 cm. The study area's climatic zone is moist sub-humid (20). Locally, the study area has an average precipitation of approximately 84 cm annually, with a mean annual temperature of 16°C (21).
Contemporary land use in the western half of the study area is predominately cropland and residential development. In the eastern portion, the North Canadian River flows through heavy urban, industrial portions of Oklahoma City. Also, Lake Overholser is one of the state's oldest impounded lakes, constructed in 1916 as the municipal water source for Oklahoma City (20,22).
Plant species present in the upland watershed area west of Oklahoma City typically include blackjack oak (Quercus marilandica), post oak (Quercus stellata), plum (Prunus spp.), skunk bush (Rhus aromatica), and various herbaceous species. Hackberry (Celtis occidentalis), elm (Ulmus spp.), cottonwood (Populus deltoides), and chittamwood (Bumelia lanuginosa) are common along the moist soil riverbanks. Beyond the study area east of Oklahoma City, the basin's vegetative cover is predominately oak forests and cleared pasture (20).
Data collection. US GLO 1872-1873 survey notes and plat maps were obtained from the Archives Division of the Oklahoma Department of Libraries in Oklahoma City. The original surveyor, Theodore H. Barrett, as mandated by the GLO, recorded common names and diameter breast height (dbh) of up to four trees as well as their distances and compass bearings from each of the PLS section corner and quarter-section corner posts. Each of the trees, referred to as bearing trees, were marked with the section, township, and range on the side facing the post. The surveyor also recorded data from trees located at the intersection of a section line with the right or left bank of the river. The surveyors recorded type of terrain, soil, understory vegetation, timber, unusual features, and major vegetation changes along section lines. We used bearing tree data on or within a 1.61-km radius of the North Canadian River between section 9 of township 11 north, range 3 west and section 10 of township 12 north, range 6 west to characterize presettlement forest conditions.
We used surveyor notes to interpret land use and land cover for the study area. This information was also depicted on GLO plat maps at a 1:31,680 scale by the surveyor.
{Page 60}
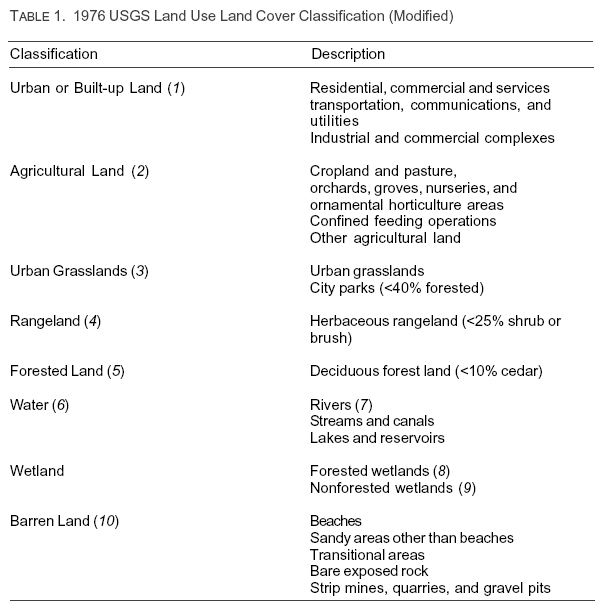
To evaluate land use and land cover for subsequent years, the U.S. Department of Agriculture black and white aerial photographs for 1941 and 1970 at a 1:20,000 scale were obtained from the Oklahoma State University Library. Copies of 1991 aerial photographs at a 1:7,920 scale were obtained from the Canadian County and Oklahoma County Natural Resources Conservation Services offices. Land use and land cover types for each of the four time periods were interpreted based on a modification of the 1976 U. S. Geological Survey (USGS) Land Use and Land Cover Classification (23; Table 1).
The interpreted boundaries for each land use or land cover type were traced from the plat maps and aerial photographs onto acetate sheets. Completed acetate coverages were then digitized by using a digital scanner. Registration points for image rectification were hand digitized from topographic quadrangle maps. The digitized coverages were imported into the graphics software package LTPlus (Line Trace Plus, version 2.22) to be edited and rectified. The edited coverages from LTPlus were imported as vector files into GRASS (Geographic Resource Analysis Support System; 24) and coverages for each year were patched together to form a complete map of the study area for that year. Polygons on completed maps were then labeled according to interpretation and rasterized with 5 m resolution.
{Page 61}
Ground truthing to verify photo-interpretation was performed for the 1991 coverage in fall 1995. Field observations were made following a predetermined route along city and county roads corresponding to PLS section and quarter section lines. Each delineated polygon was located in the field, and all polygons were compared with photo-interpretations results.
Data analysis. Surveyors recorded up to four bearing trees per sample point. Total number of trees recorded for the study area and used in the analysis was 541 of which 252 trees were located in the eastern half and 289 in the western half. Data from 265 sites were treated as point-centered quarter samples, where distance to nearest tree and dbh were used to calculate average distance density, and mean basal area. Dominance ranking was calculated by dividing mean basal area by the number of trees for a given species and frequency was the number of times a species occurred over all sample points (17,25-27). Absolute frequency was calculated by dividing the number of points with a given tree species by the total number of points (26).
Although the point center quarter methodology assumes that trees are randomly distributed, typically a single species in a mixed species stand will be clumped in distribution, thereby underestimating true density (26). Even with this limitation, relative comparisons can be made with similar data (19). Species composition and relative occurrences can also be reasonably inferred by this type of data (19).
All four digitized coverages were imported into Arc/Info's GRID module or raster-based geoprocessing system (28). FRAGSTATS, a spatial pattern analysis program for quantifying landscape structure (29), accepts Arc/Info SVF files and was used for landscape analysis of this study. Temporal changes in landscape composition and relative abundance were measured by using the metrics for area and diversity. Because the study area was divided into two unique halves, analysis was conducted separately on each half to provide a comparison of the urban and rural influences.
FRAGSTATS was used to calculate the area for each patch type as well as to calculate total landscape size. Percentage of the landscape occupied by each patch type was calculated to quantify area in more relative terms. Several statistical analyses were used to quantify diversity at the landscape level. Two components of diversity are richness and evenness. Richness is simply the number of patch types present. Relative richness relates richness as a percentage of the total possible patch types present. Two diversity indexes were used along with their corresponding evenness indices, Shannon's diversity index (30) and Simpson's diversity index (31). Shannon's diversity index equals 0 when only one patch occurs in the landscape. Shannon's diversity increases as patch richness increases and/or as the proportional dis-tribution of area becomes equal among patches. Simpson's diversity index (31) calculates the probability that any two patches selected at random will be different types. Landscapes with only one patch type have values of 0. As the number of different patch types increases and the proportional distribution of area among patch types becomes more even, the index value approaches 1. Shannon's evenness and Simpson's evenness are expressed as the observed level of diversity divided by the maximum possible diversity for a given patch richness. The closer the evenness index is to 1, the more even the distribution of area among patch types (30,31).
| Introduction | Materials and Methods | Results | Discussion | References | Top of Page | Table of Contents | Home |
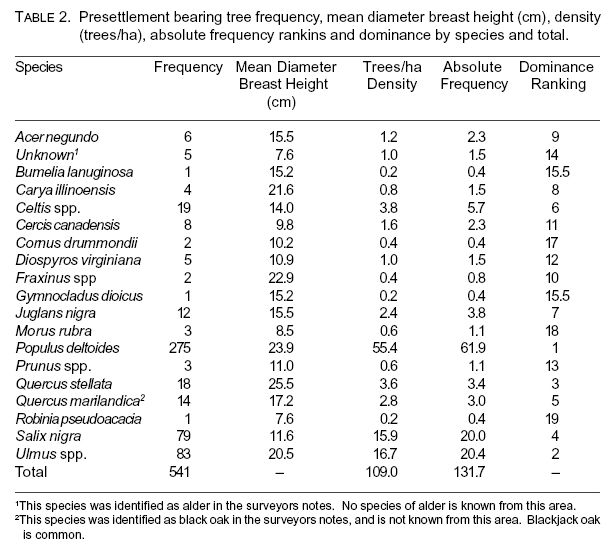
Bearing tree data. Of the 541 trees recorded from the GLO survey notes, 19 taxa were identified and recorded (Table 2). Of the 19 taxa, 15 were present in the western half and 17 in the east. The surveyor identified trees by common name only and not always to species. For example, trees of the genus Ulmus were identified all as "elm" even though two species, American elm (U. americana) and Slippery elm (U. rubra), are known from the study area (32).
Cottonwood was the most prevalent species followed by elm. Both are common
{Page 62}
stream border species. Post oak, an upland species, was third in dominance rank but had a much lower density (3.6 trees/ha) than that of willow (Salix nigra, 15.9 trees/ha), which ranked fourth in dominance. This is because post oak had a larger average dbh than all species present, whereas willow had a higher frequency of occurrence than post oak. Willow is most often found with cottonwoods in wet soils bordering steams (32). In the western half, willow occurred with greater frequency than elm or post oak (Table 2). Again, average dbh for willow was much smaller. Only five post oaks were recorded in the east with an average dbh of 26.4 cm. Post oak was the dominant upland species found within the forested riparian corridor. Another upland species, blackjack oak, was fifth in dominance rank. The average dbh of the 14 blackjack oak trees recorded was only 17.2 cm. Although this species was identified as black oak in the surveyor's notes, likely it was blackjack (Q. velutina) is not known from the area (32). The average presettlement tree density of the study area was 109 tree/ha.
Area indices.The landscape area varied through time because we chose to let the buffered area define study area boundaries. Otherwise, a larger study area would have extended well into the 1941 to 1991 uplands. Change in the study area size was minimal from 1941 to 1991. The North Canadian River was reduced in width by approximately 50% by 1941 and another 50% by 1970 based on comparison of surveyor measurements and measurement of width from photography. The reduction corresponds to straightening and narrowing of the river. The straightening of the river caused an overall reduction in size of the study area even though east and west boundaries remained the same and the buffer
{Page 63}
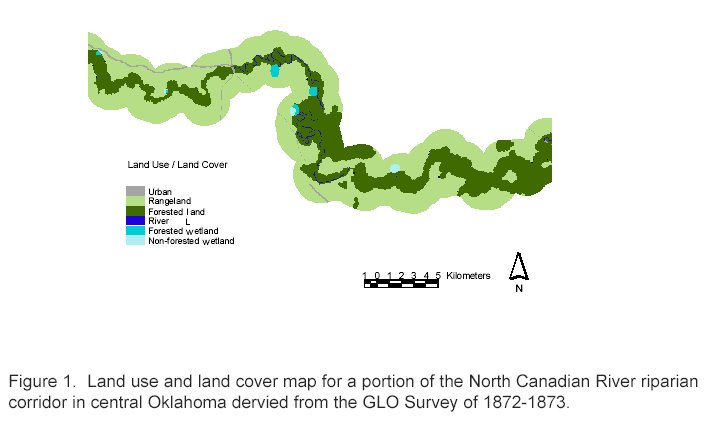
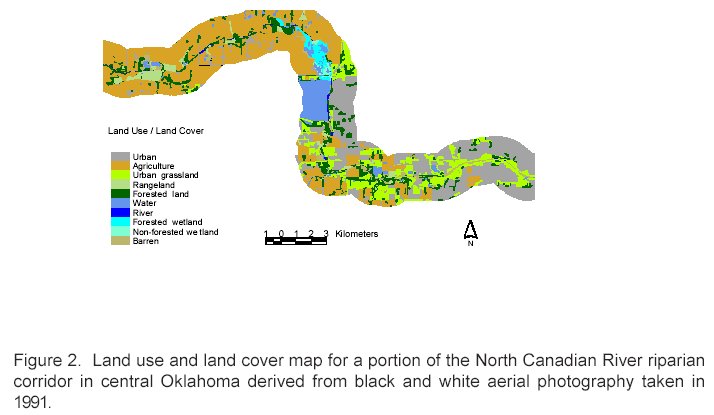
area surrounding the river remains the same at 1.61 km. The size of the study area was 17,570.4 ha in 1872 and 13,566.9 ha in 1991—a 23% decline (Table 3 and 4). It is important to note that the change in overall size of the study area will affect analysis for patch type. For example, the total area of forested land in 1872 was 5,199.7 ha and 1,087.5 ha in 1991 (Fig. 1 and 2). The total landscape area in 1872 was 17,570 ha and 13,567 ha in 1991. Therefore, the decrease in area may be misleading and should be taken into consideration. However, individual patch size is not as affected by overall size change because each is considered separate from total landscape size.
The greatest change in existing land use occurred between 1872 (Fig. 1) and 1941 as urban or developed land increased 1,985.5% (Table 3). Then from 1941 to 1991, urban grassland increased 379.5%. Barren land also increased through each time period. Agricultural land use displaced a majority of the rangeland, with a 7.5% loss of range-
{Page 64}
This page was intentionally left blank.
{Page 65}
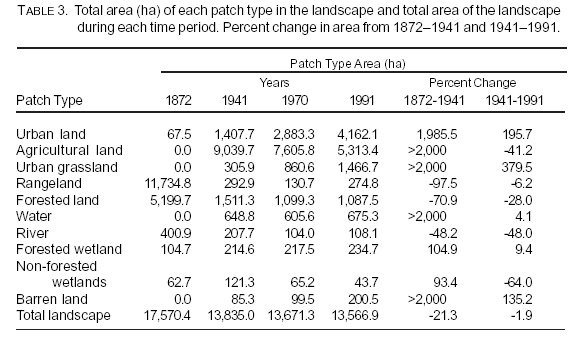
land between 1872 and 1941. Rangeland declined at a slower rate through 1970 and in 1991 was 6.2% less than that measured in 1941. Agricultural lands have since decreased 41.2%. Forested lands decreased 70.9% by 1941, but have only dropped 28.0% over the past 50 years.
With the impoundment and creation of Lake Overholser, the amount of open contained water in the study area increased from 0 to 648 ha by 1941. Numerous farm ponds were built after the dust bowl and also contributed to the increase in water present. Lake Overholser created an increase in wetlands directly upstream. Forested and nonforested wetlands nearly doubled by 1941. Over the past 50 years, forested wetlands have increased slowly, while nonforested wetlands decreased by 64.0%, which is still proportionally less than in 1872.
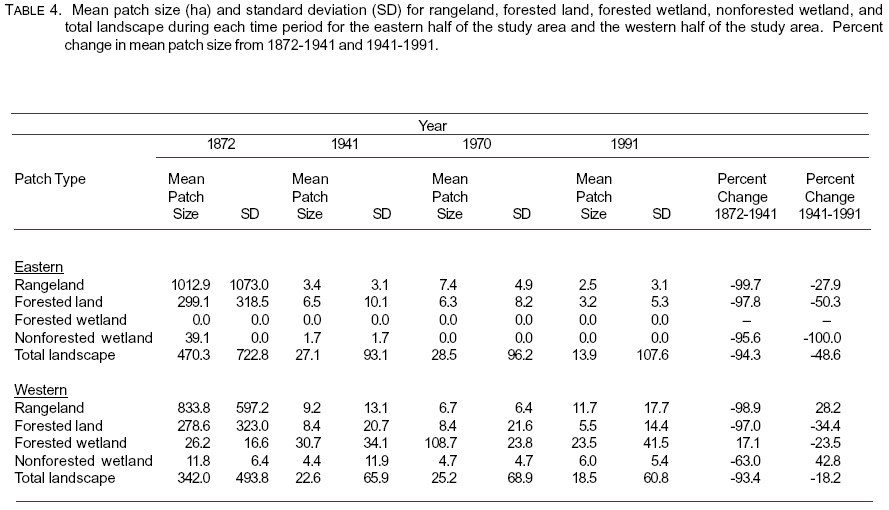
Patch size indices. The mean patch size for the entire study area declined approximately 94% from 1872-1941 (Table 4). Rangeland and forested lands separately had mean patch size reductions of over 97% from 1872 to 1941. For example, mean patch size for rangeland in the eastern half of the study area dropped from 1,012.9 ha to 3.4 ha. Average patch size for forested lands remained about the same from 1941-1970, but again dropped in 1991.
Mean patch size of rangeland in the western half of the study area increased by 28.2% since 1941. In contrast, mean patch size of rangeland in the eastern half has decreased 27.9%.
In 1872 and 1941, wetlands were mainly in the western half of the study area. By 1970, there were no wetlands found downstream of Lake Overholser. Average patch size for nonforested wetlands decreased 63% from 1872 to 1941. Since 1941 nonforested wetlands have increased by nearly 43%. Forested wetlands increased in average patch size from 26.2 ha in 1872 to 30.7 ha in 1941. Average patch size for forested wetlands increased again to 108.7 ha in 1970, but decreased to 23.5 ha in 1991.
Landscape diversity indices. The maximum number of patch types possible (richness) for the study area is 10. Richness varied from 5 in the eastern half of the study area in 1872 to the maximum 10 in the western half for 1941, 1970, and 1991 (Table 5). The only cover type not present in the eastern half in 1941 was forested wetland. Overall, diversity increased through each time period. Shannon's diversity showed the greatest increase, 60%, from 1872 to 1941. Otherwise,
{Page 66}
{Page 67}
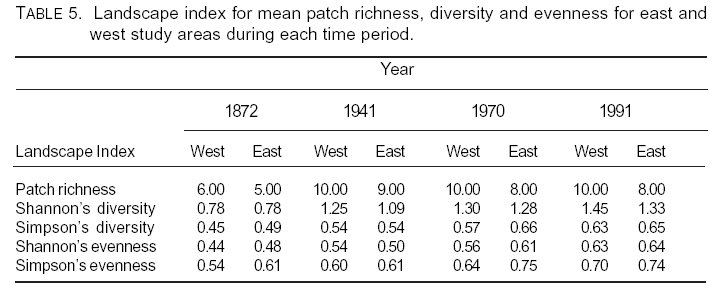
changes in diversity ranged from 3% to 20% higher. Both Shannon's and Simpson's evenness index increased from 0% to 23%.
| Introduction | Materials and Methods | Results | Discussion | References | Top of Page | Table of Contents | Home |
Much of the original plant cover that dominated the riparian corridor has been replaced by human developments (Figs. 1-2). In 1872, the riparian corridor was dominated by cottonwood mixed with willow, elm, post oak, and several other species. Occasionally surveyors would also reference undergrowth species such as plum or redbud. The low frequency of upland species suggests that the forested community surrounding the river was predominately true riparian or flood tolerant species such as cottonwood and willow. Dominant upland species present in the study area were post oak and blackjack oak. These upland and bottomland communities were similar across the whole study area. The total tree density of the study area was 109 trees/ha. Some have suggested that >99 trees/ha suggests a closed forest community (17). However, it is difficult to consider 109 trees/ha a closed forest in comparison to a study estimating recent tree density up to 615 trees/ha (15).
Tree density in 1896 on the McCurtain County Wilderness Area of the Ouachita Mountain region of southeast Oklahoma was estimated much lower, 71 trees/ha (15), than presettlement (1872) tree density along the North Canadian River. In eastern Arkansas and Missouri, average estimated presettlement (1815) tree density was 92 trees/ha along the 5th Principal Meridian (17). Nelson (17) estimated 79 trees/ha in Ozark Plateau, 68 trees/ha in Dissected Till Plain, and 146 trees/ha in Mississippi Alluvial Plain. Mississippi Alluvial Plain is a topographically low, flat, river-floodplain as is the area surrounding the North Canadian River.
The 1872 study area was a simple landscape (richness=6) dominated by rangeland and forested land. The mean patch size of rangeland cover type in the eastern half of the 1872 landscape was 1,013 ha (+1,073 ha) with the largest single contiguous patch composing 31% of the total landscape. Although of low density, the forested land had high connectivity (Fig. 1). The remainder of the landscape in 1872 consisted of a small area of urban land use (a dirt trail), small isolated patches of forested and nonforested wetlands, and the North Canadian River. The low values of the diversity index produced for this time period were indicative of a landscape dominated by a few patch types of large size and suggested that the area distribution was not even among patch types (29).
The most apparent change by 1941 was the presence of human development. Almost all of 1872 native rangeland and forested land was shifted to agricultural land use and urban land use. Agricultural land use consisted of primarily wheat farming along with grain sorghums, barley, oats, and some cotton. Urban land use within the study area was light development or residential housing of Oklahoma City. The population of Oklahoma County in 1940
{Page 68}
was around 116,000, and clustered in the metropolitan area (33).
As urban development has grown, agricultural land has steadily declined, especially in the eastern half of the study area. Agricultural property within Oklahoma City has been developed into residential areas. Reduction in the amount of agricultural land in the rural areas west of the city happened because of the reversion of cropland and pastures to unmanaged introduced grasslands. The amount of rangeland has increased to proportions closer to that found in 1941. Due to the development of heavily wooded parks, establishment of trees in drainage basins, and reestablishment of trees directly along the river, forested land in the eastern half has slightly increased since 1970. However, the overall percentage of forested land present is still much lower than in 1872.
Several studies have shown changes in or elimination of natural vegetation caused by human activities such as agriculture and urbanization have created a landscape mosaic of habitat fragments (2,6,34). This is quite apparent in this study with a 97% reduction in the patch size of rangeland and forested land by 1941. Corresponding with the drop in patch size was the drop in patch size standard deviation. Anthropogenic land alterations typically create more patch size uniformity with simple patch shapes than found in unaltered patch mosaics (29,35). This can also be seen when comparing rural and urban landscapes. Patch size standard deviations are larger for the western half or rural portion than the urban eastern half. Through time the landscape has changed from being dominated by a few patch types clumped closely together to a fragmented landscape of greatly interspersed patches of different types (34).
The major alteration in the North Canadian River, first seen in the 1941 study area photos, was the impoundment by Overholser Dam in 1916 as Oklahoma City's municipal water source, capable of holding 26.5 gal of water (20,22,33,36). A large area of wetlands, consequently, extends directly upstream from the lake, consisting of forested and nonforested wetlands, as well as small shallow lakes. This area is now the Stinchcomb Wildlife Refuge. A patch of forested wetland 31 ha in size existed in 1872 in the same area as these wetlands, according to the GLO survey notes. The lake comprises a majority of water cover type found in 1941 coverages.
The North Canadian River is much narrower than historical widths and much straighter. Stream width reductions are most likely due to alterations in dynamics of forested riparian systems below impoundments constructed for control of flood frequency and magnitude as well as reduction of sedimentation rates and river meandering (12). Human alterations in the landscape have been changing flood regimes ever since settlement (37,38). After a record flood in 1923 broke the Overholser Dam, more upstream impoundments were initiated to control flooding (21).
The most obvious trend in land use change is increasing urban development. The number of transportation corridors, housing developments, and utility and water services have increased since settlement. These types of changes in the landscape were made with little thought as to the ecological impact (39). Anthropogenic landscape alteration may be viewed as a long-term disturbance both in duration and consequence (40). One study suggests that conservationists should focus efforts on loss of biodiversity caused by increased human activity in densely populated rural areas surrounding urban centers (41).
Conversion of rangeland to cropland, impoundment of the North Canadian River, and growth of Oklahoma City infrastructure have all occurred to benefit human habitat conditions and are now permanent factors affecting the riparian corridor. Although succession to a presettlement condition simply cannot occur due to the presence of impoundments (12), restoration efforts are imperative to preserve aquatic and riparian biodiversity (37). The cottonwood is no longer the predominant tree species along the riparian corridor. Species such as elm and hackberry are now more prevalent.
Data show that the riparian vegetation community along this portion of the North Canadian River was historically continuously forested. In response to the
{Page 69}
concerns of Knopf (11), the inclusion of a forested riparian community along this portion of the North Canadian River would not create a habitat that was historically absent. The next important step in restoring the corridor is to empirically analyze the current vegetation composition found within the study area and to begin reestablishing the historic landscape community structure through exotic plant control and native plant reintroductions. Restoration includes the reestablishment of the functions, processes, and products of a self-sustaining ecosystem and should be addressed at a regional or watershed level (37,42). Reconstruction of the riparian corridor would serve to restore an ecologically valuable community having benefits such as habitat, water purification, aesthetics, and recreation for both wildlife and humans.
Washington Irving, during his travels through Oklahoma in autumn of 1832, crossed the North Canadian River in close proximity to this study area. He described the valley of the North Canadian as follows: "A beautiful meadow about half a mile wide, enameled with beautiful autumnal flowers, stretched for two or three miles along the foot of the hills, bordered on the opposite side by the river, whose banks were fringed with cottonwood trees, the bright foliage of which refreshed and delighted the eye" (43). His description is far from the scene today. Forest cover has changed and been reduced to the point that there were not enough timbered points from which to gather bearing tree data to conduct a comparable analysis of tree density for present day composition. At least 20 points are recommended (24), but only 4 survey points existed from which bearing trees could be measured.
Funding was provided by Oklahoma State University, Department of Forestry and Oklahoma Agricultural Experiment Station. This is published with approval by the Director of Oklahoma Agricultural Experiment Station. We also acknowledge useful reviews by anonymous POAS reviewers. We especially thank K. Gainey for assistance with figures and manuscript preparation.
| Introduction | Materials and Methods | Results | Discussion | References | Top of Page | Table of Contents | Home |
1. Tiner RW. Wetlands of the United States: current status and recent trends. Washington, D.C.: U.S. Fish and Wildlife Service, National Wetlands Inventory; 1984. 57 p.
2. Adams LW, Dove LE. Wildlife reserves and corridors in the urban environment. Columbia, Maryland: National Institute for Urban Wildlife. 1989. 91 p.
3. Naiman RJ, Decamps H, Pollock M. The role of riparian corridors in maintaining regional biodiversity. Ecol App 1993; 3:209-212.
4. Brabander JJ, Masters RE, Short RM. Bottomland Hardwoods of Eastern Oklahoma: a study of their status, trends, and values. U.S. Fish and Wildlife Service and the Oklahoma Department of Wildlife conservation. 1985. 147 p.
5. Stinnett DP, Smith RW, Conrady SW. Riparian areas of Western Oklahoma. U.S. Fish and Wildlife Service and Oklahoma Department of Wildlife Conservation. 1987. 80 p.
6. Forman RTT, Godron M. Landscape ecology. New York: John Wiley and Sons. 1986. 620 p.
7. Lant CL, Tobin GA. The economic value of riparian corridors in cornbelt floodplains: a research framework. Prof Geog 1989; 41:337-349.
8. Vought LB-M, Pinay G, Fuglsang A, Ruffinoni C. Structure and function of buffer strips from a water quality perspective in agricultural landscapes. Landscape and Urban Planning 1995; 31:323-331.
9. Schaefer JM, Brown MT. Designing and protecting river corridors for wildlife. Rivers 1992; 3:14-26.
10. Roper BB, Dose JJ, Williams JE. Stream restoration: is fisheries biology enough? Fisheries 1997; 22:6-11.
11. Knopf FL. Faunal mixing, faunal integrity, and the biopolitical template for diversity conservation. Trans of the
{Page 70}
12. Knopf FL, Scott ML. Altered flows and created landscapes in the Platte River headwaters, 1840-1990, In: J.M. Sweeney, ed. Management of dynamic ecosystems. West Lafayette, IN: North Cent. Sect., The Wildl Soc; 1990. p. 47-70.
13. Knopf FL, Samson FB. Scale perspectives on avian diversity in western riparian ecosystems. Conser Biology 1994; 8:669-676.
14. Samson FB. Conserving biological diversity in sustainable ecological systems. Trans North American Wildlife and Natural Resources Conference 1992; 57:308-320.
15. Kreiter SD. Dynamics and spatial patterns of a virgin old-growth hardwood-pine forest in the Ouachita Mountains, Oklahoma, from 1896-1994 [M.S. Thesis]. Stillwater, OK: Oklahoma State University, 1995. 141 p.
16. Wilson CW, Masters RE, Bukenhofer GA. Breeding bird response to pine-grassland restoration for red-cockaded woodpeckers. J Wildl Manage 1995; 59:56-67.
17. Nelson JC. Presettlement vegetation patterns along the 5th Principal Meridian, Missouri Territory, 1815. Am Midl Nat 1997; 137:79-94.
18. Bourdo EA. A review of the General Land Office survey and of its use in quantitative studies of former forests. Ecology 1956; 37:754-768.
19. Whitney GG, DeCant JP. Government land office surveys and other early land surveys. In: Egan D, Howell EA, editors. The historical ecology handbook. Washington, DC: Island Press; 2001. p 147-172.
20. Ghermazien T, Zipser RA. Hydrologic investigation of the North Canadian River basin. Oklahoma City, OK: Publication No. 103, Oklahoma Water Resources Board, Stream Water Division; 1980. 26 p.
21. Oklahoma Water Resources Board. Oklahoma water atlas. Norman, OK: University of Oklahoma Printing Services; 1990. 360 p.
22. Ruth K. Oklahoma, a guide to the Sooner State. Norman, OK: University of Oklahoma Press; 1957. 532 p.
23. Anderson JR, Hardy EE, Roach JT, Wilmer RE. A land use and land cover classification for use with remote sensor data. Washington, DC: U.S. Department of the Interior, Geological Survey Professional Paper No. 964, U.S. Government Printing Office; 1976. 28 p.
24. Shapiro M, Westervelt J, Gerdes D, Larson M, Brownfield KR. GRASS 4.0 users manual. Champaign, IL: U.S. Army Corps of Engineers Construction Engineering Research Laboratory; 1992.
25. Cottam G, Curtis JT. A method for making rapid surveys of woodlands by means of pairs of randomly selected trees. Ecology 1949; 30:101-104.
26. Muller-Dombois T, Ellenberg H. Aims and methods of vegetation ecology. John Wiley & Sons, NY; 1974. 547 p.
27. Metzger JP. Relationships between landscape structure and tree species diversity in tropical forests of South-East Brazil. Landscape and Urban Planning 1997; 37:29-35.
28. ESRI. Understanding GIS: the ARC/INFO method: revision 6 for work-stations. John Wiley & Sons, Inc., NY: Environmental Systems Research Insti-tute, Inc. 1993. 532 p.
29. McGarigal K, Marks BJ. FRAGSTATS: spatial pattern analysis program for quantifying landscape structure. Port-land, OR: Gen. Tech. Rep. PNW-GTR-351. U.S. Department of Agriculture, Forest Service, Pacific Northwest Research Station; 1995. 122 p.
30. Shannon CE, Weaver W. 1962. The mathematical theory of communication. Urbana, IL: University of Illinois Press; 1962. 117 p.
31. Simpson EH. Measurement of diversity. Nature 1949; 163:688.
32. Little EL. Forest trees of Oklahoma. Oklahoma City, OK: Publication No. 1, Revised Edition No. 14, Oklahoma State Department of Agriculture, Oklahoma Forestry Services; 1996. 205 p.
{Page 71}
33. Morris JW. 1954. Oklahoma geography. Oklahoma City, OK: Harlow Publishing; 1954. 154 p.
34. Kattan GH, Alvarez-Lopez H, Giraldo M. Forest fragmentation and bird extinctions: San Antonio eighty years later. Conser Biology 1994; 8:138-146.
35. Farley SC. Landscape linkages and riparian changes in central Oklahoma. Stillwater, OK: M.S. Thesis, Oklahoma State University; 1997. 81 p.
36. Gould CN. Travels through Oklahoma. Oklahoma City, OK: Harlow Publishing Company; 1928. 174 p.
37. Kauffman JB, Beschta RL, Otting N, Lytjen D. 1997. An ecological perspective on riparian and stream restoration in the eastern United States. Fisheries 1997; 22:12-24.
38. Maekawa M, Nakagoshi N. Riparian landscape changes over a period of 46 years, on the Azusa River in Central Japan. Landscape and Urban Planning 1997; 37:37-43.
39. Dix ME, Akkuzu E, Klopfenstein NB, Zhang J, Kim M, Foster JE. Riparian refugia in agroforestry systems. J Forestry 1997; 95:38-41.
40. Thomlinson JR, Serrano MI, Zimmerman JK. Land-use dynamics in a post-agricultural Puerto Rican landscape (1936-1988). Biotropica 1996; 28:525-536.
41. Boren JC, Engle DM, Gregory MS, Masters RE, Bidwell TG. Landscape structure and change in a hardwood forest-tall-grass prairie ecotone. J Range Manage 1997; 50:244-249.
42. Wyant, J.G., R.A. Meganck, and W.H. Ham. A planning and decision-making framework for ecological restoration. Environ Manage 1995; 19:789-796.
43. Irving W. A tour on the prairies. Oklahoma City, OK: Harlow Publishing Corporation; 1955. 178 p.
Received: May 10, 2002; Accepted: Oct 28, 2002