
|
 |
|
{Page 95}
Department of Geography, Oklahoma State University, Stillwater, OK 74078
Freemasonry is one of the oldest lodge-style fraternal systems in the world. After the founding of the first American lodge in 1731, Masonry spread across the United States. The original Oklahoma Territory lodge formed in 1874, and after the Grand Lodge of Oklahoma was organized in 1909, Masonry flourished in Oklahoma until the 1960s. However, the last four decades have witnessed steady declines of membership, both in Oklahoma and nationwide. This paper analyzes Masonic membership in Oklahoma to identify the demographic and socioeconomic characteristics that most closely correspond to higher or lower levels of membership in Oklahoma's counties. While Masonry is in steep decline statewide, the factors that influence this decline are different in different parts of the state. Identifying significant relationships and valid predictor variables of membership levels will lead to a better understanding of which population groups are more or less likely to join or remain members of a Masonic Lodge. We also discuss regional patterns of the socioeconomic influences on membership rates. This information will be of use to the Grand Lodge of Oklahoma in remedying this decline, but it also provides insight into an important cultural phenomenon that may be vanishing from our society. © 2002 Oklahoma Academy of Science
| Introduction | Methods | Results and Discussion | Conclusions | References | Top of Page | Table of Contents | Home |
Membership in voluntary organizations is in a state of serious decline in the United States. Well-known organizations like the Masons, Shriners, Elks, and Lions have experienced notable membership decreases in the late 20th century (1), as have churches (2). Explanations are varied, ranging from changing social factors to structural changes in Americans' free time and leisure. Fost (1) identified changing attitudes toward work, leisure, and the role of the American male for much of this decline. He further noted that the elaborate ornamentation associated with most fraternal lodge systems, such as the fez worn by Shriners, was an additional deterrent for most baby boomers. Similarly, Putnam (2) felt that rising divorce rates, smaller families, television, and longer commuting times further eroded the popularity of fraternal and civic organizations.
This article had two goals. First, we used statistical analysis to evaluate the membership structure in the 1990s to determine which socioeconomic variables related most strongly to higher or lower levels of Masonic membership in Oklahoma. Because the various variables were extracted from different sources, the level of spatial detail was not consistent across the data set and, therefore, we aggregated to the least detailed spatial unit in the data set, which was the county level. Cimarron County contains no lodges, so our data set consisted of 76 observations for Oklahoma. We used statistical methods derived from regression analysis to find significant links between Masonic membership and socioeconomic variables including age, commuting time, education, income, occupation, political and religious activity, and residential location.
Second, we mapped pertinent statistical results to demonstrate the regional variability of Masonry and significant variables in Oklahoma. Although a simple remedy for Freemasonry in Oklahoma does not exist, understanding what socioeconomic conditions and what regions are more or less amenable to Masonic membership provides
{Page 96}
the Grand Lodge of Oklahoma with information it can use to focus its recruiting and retention efforts.
Freemasonry was once a deeply secret and often vilified activity. The secrecy was both an attraction to petitioners and a source of criticism to those on the outside (3). It has also drawn criticism from feminists due to its exclusion of women (4), from the papacy due to its natural religion and deism (3), and from a society that has grown ever more accustomed to, and perhaps even accepting of, a lack of true secrecy and privacy. The secrecy of Masons is more part of its mystique and history today than reality, and much information is publicly available in terms of meeting locations, rituals, titles, and membership. Masonry today more strongly resembles most other civic organizations in its support of charities such as Shrine Hospitals and the Scottish Rite speech program, as well as its goal of bringing together like-minded individuals for friendship and fellowship. Though it has retained strong vestiges of its original customs, once rooted in deep secrecy, the organization has gradually evolved to maintain its relevancy in society.
A historical review of fraternal organizations in the United States provides some context to the reasons for the current membership crisis. Below, we will briefly describe characteristics of secret societies and service clubs. We will then review previous research that has tried to identify what causes people to join, or not to join, such organizations to determine appropriate variables for statistical analysis. Finally, we will summarize geographic studies of voluntary organizations.
Fraternal and Voluntary Organizations in the United States. The origins of American fraternal organizations can be found in 18th-century America, but in the 19th century the influence of the Masons led to many imitators and an explosion of male-only, secret societies (5). Although evidence that Freemasonry actually inspired the American Revolution and the American Constitution generates strong debate, unquestionably Masonry has been the most influential fraternal organization and has served as the model for virtually all later such organizations in the United States (3). An outgrowth of the colonial era, men's fraternal clubs evolved along religious, social, and political lines (6), typically admitted new members by invitation only, and featured ornate paraphernalia and secret rituals that enhanced the groups' identities (4).
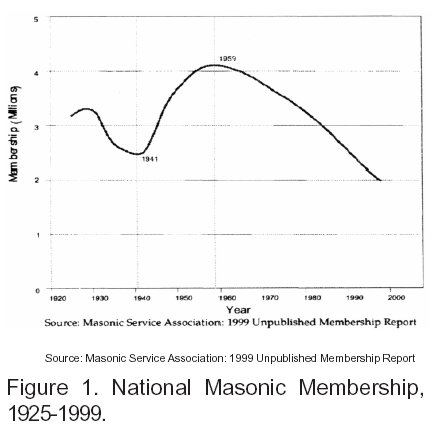
Fraternal organizations generally gained popularity through the 19th century, but the 20th century has been an era of waxing and waning popularity. Workplace and social changes, along with the Great Depression, led to a decline in the 1930s. Also, the early 20th century spawned less secret, service-oriented organizations such as the Kiwanis, Lions, and Rotarians (4). Fraternal and service organizations declined during World War II because of the mobilization of large numbers of potential and active members. Membership levels then recovered and, for Freemasonry, peaked in the 1950s at the height of the anti-communist era before commencing a startling and unparalleled decline that continues to the present (2).
In contrast, although service clubs also experienced declines during the Depression, World War II, and the 1990s, they had slow but steady growth from the 1960s through the 1980s (7). A few, such as the Knights of Columbus and Rotary International, have actually had moderate growth in the 1990s (1). National Masonic membership patterns (Fig. 1), however, clearly demonstrate the national trend in declining American participation in this organization (8).
{Page 97}
Sociologists have formed a long list of reasons for the decline of fraternal and service organizations, including declining family values, increased mobility and commuting times, television, and changing views on men's roles in society and the household. Additionally, negative connotations associated with the ritualism and symbolism of Freemasonry, reduction of the communist threat in the later stages of the cold war, and increased social awareness have contributed to the decline of secret and fraternal organizations. Meanwhile, many of these same issues have led to higher popularity for more open service organizations (1,2,4), the rise of parallel women's service clubs (5), and to the Elks, Kiwanis, and Rotarians admitting women (1).
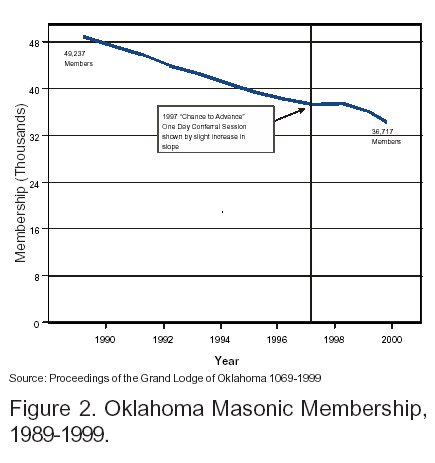
Oklahoma's Masonic membership is also in a state of decline. State-level membership records (9) for the 1990s demonstrate that the trend in Oklahoma (Fig. 2) has mostly mirrored that of the nation, except for a one-time membership drive in 1997 called "Chance to Advance."
Appropriate Variables. The basis of this study was the identification of appropriate variables that may correlate to Masonic membership in Oklahoma. The family of statistical methods based on regression analysis is very useful for reducing a large list of explanatory variables; but from the outset we wished to select logical variables that represent known or assumed connections between fraternal and service club membership and socioeconomic characteristics.
Conflicting evidence exists on the role of economic status in relation to membership. In seminal early works on the subject, Wright and Hyman (10) linked membership trends to specific occupations and educational levels. Hausknecht (6) similarly found that income and membership correlated positively. Shortly thereafter, Hodge and Treiman (11) and Mueller and Johnson (12) found only weak and insignificant links. More recently, Oliver (13) found that club membership was actually lower in cities with higher median incomes. Given the conflicting evidence and the importance of income and wealth in our society, we included variables measuring different aspects of economic status and occupation to determine whether they influence Masonic membership.
Kaufman (14) found that associationalism, the tendency to join associations, generally promoted voter participation in terms of voter turnout. Putnam (2) felt that recent evidence indicated that the simple act of voting led to higher levels of volunteer and civic participation. Although the actual values are likely not applicable today, Hausknecht (6) identified specific percentages of various party affiliates who were also members of voluntary associations, suggesting that people who believed a certain way and who could be identified by political affiliation showed distinct trends in joining voluntary organizations. Hence, information on voter affiliation and turnout warranted inclusion in this study.
Religiosity connects to both associationalism and political activism. Secret et al. (15) observed that religious activity spurred political participation. This link to political activism also encourages active membership and participation in voluntary organizations, echoing earlier research on the links between politics, religion, and associationalism (16). With the long-standing ban on Catholics being Masons, giving rise to the Knights of Columbus as a Catholic corollary to Masonry (3), religiosity merits study as a possible influence on Masonic membership.
{Page 98}
Age, commuting times, and locational variables were included for some specific reasons. Age was included as an independent variable because one must be 18 years old to join the Masons, and a commonly held perception is that lodges are becoming elderly and are shrinking in membership as these elderly members die off. Putnam (2) determined that each additional 10 min of commuting time reduced social capital by 10%, reducing available leisure time for men to join such organizations. Wikle (7) found that Kiwanis membership was stronger in rural areas (counties and states), and a link between age and rural living can be argued. Given the perception that American youth are leaving rural areas for cities and that the baby boom generation is less likely to be involved in fraternal organizations (1), aging rural areas of Oklahoma were expected to have higher-than-average Masonic membership levels.
Geographic Research on Voluntary Organizations. Service clubs have received only limited attention from academia (7) and geographic studies are even scarcer. In 1935, Marden conducted a national study of Rotary International, although no information was mapped (17). Wikle studied the spatial patterns of both American environmental organization membership (18) and Kiwanis Club membership (7). Mazur and Welch (19) also studied environmentalism, but they used four different measures of the phenomenon: membership, public opinion, congressional representation, and state-level environmental policy.
The primary limitations of social and economic data are that they are gathered within governmentally-defined areal units, and analysis is usually limited to the lowest common level of spatial detail. Wikle (7,18) conducted both county-level and state-level analyses, the latter mainly to determine whether patterns of Kiwanis membership or environmentalism were similar at different levels of spatial resolution, which they were. Mazur and Welch (19), because of their inclusion of variables capturing the effect of state congressional leadership and their assertion that states are largely responsible for implementing federal environmental laws, limited their analysis to the state level. For this study, counties in Oklahoma were the lowest common spatial level in the data set, and all analyses were thus conducted at that level.
Mazur and Welch, in combining the above-mentioned four indicators of environmentalism, found that the northeast quadrant and the west had the most environmental concerns, though each of the four indicators had its own unique traits that did not follow the overall pattern. They also found that pollution levels were not the strongest indicator of environmentalism but rather the residents' educational levels, degree of liberalism, and wealth were the most important. They further found that education and electricity consumption levels were very strongly correlated with environmentalism, but also reviewed the role of historical cultural traditions (19).
Wikle's studies (7,18) both analyzed membership totals using the same quantitative method, the location quotient. Location quotients are ratios of activity levels in smaller regions (such as counties) to the average activity level in a larger region (such as the US). In both papers, Wikle analyzed membership at the county and state levels relative to the US national average. Each county or state had a calculated location quotient value, and these were mapped to display regional patterns of membership tendencies. While some of the specific trends mapped at the county level were less apparent at the state level of analysis, overall the patterns were very similar.
In Wikle's study of environmental organization membership (18), the north, west, and Rocky Mountain regions of the US were the most strongly environmentalist, similar to Mazur and Welch's findings (19). High membership ratios were associated with areas dominated by upper-middle class residents, notable outdoor recreational areas, or with on-going resource threats in the vicinity. Wikle also found that areas of greater environmental concern tended to correlate more highly to populations with higher incomes and educational attainment (18).
Wikle's study of Kiwanis membership
{Page 99}
revealed a very strong pattern of high membership ratios in the upper Plains and Rocky Mountain states and in rural counties. His conclusion was that people tended to join more in rural, isolated communities due to decreased availability of recreational or social outlets, and the desire to establish business contacts among members (7).
| Introduction | Methods | Results and Discussion | Conclusions | References | Top of Page | Table of Contents | Home |
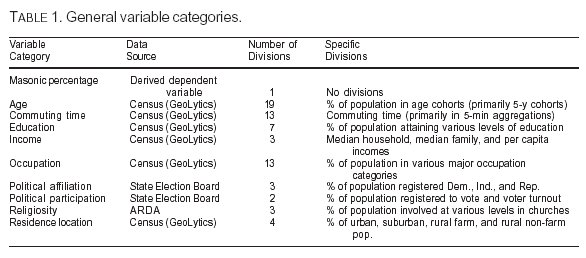
Data Collection and Sources. The demographic and socioeconomic variables described in the preceding section were independent variables in this analysis. They represented indications of underlying relationships in this study, and helped us identify the social characteristics that lead to higher or lower levels of Masonic membership at the county level. Unless otherwise indicated, these variables were extracted from data vendor GeoLytics, Inc. (East Brunswick, NJ) that combines the 1990 US Census, county time series, and historical data to produce estimates and projections in the CensusCD+Maps package. Table 1 summarizes the variables.
The choice of 1990 as the benchmark date of analysis was chosen for several reasons. Pragmatically, all variables from the 2000 Census had still not been released at the time of the final preparation of this article. Philosophically, we wanted to study the decline in Oklahoma membership that has already occurred in the 1990s. By evaluating the relationship between membership levels as tallied in 1990 to the Census data from the same year, we sought to isolate and quantify relationships that existed at the commencement of the membership decline of the past decade. It is this decline that lodge leaders are hoping to stem, and their retention and recruitment efforts will be aided by understanding the causes of the decline by identifying the possible root causes that were in place as this decline proceeded. By the end of 2002, it should be possible to reevaluate this relationship using 2000 data for both membership and socioeconomic characteristics. It should be interesting to compare the results of the present study based on 1990 data with a 2000 study, but space and data availability limitations preclude reporting here.
Additionally, this study operated under the assumption that socioeconomic characteristics at the county level applied to all Masons who attended lodges in those same counties. Cross-county ravel to attend lodge functions certainly exists, but it is unmeasurable in the data we were provided. Furthermore, we believe that this type of behavior is infrequent and that there are no significant socioeconomic differences between Masons who travel across county lines to attend a lodge and those who do not.
Age variables were the percentages of the total population in various cohorts. Because one must be at least 18 years old to join the Masons, the divisions chosen for this study were ages 18, 19, 20, 21, 22-24, 25-29, 30-34, 35-39, 40-44, 45-49, 50-54, 55-59, 60-61, 62-64, 65-69, 70-74, 75-79, 80-84, and 85 or older. The lower ages are not
{Page 100}
aggregated, to focus on whether an influx of membership occurs at the earliest eligible ages. The Census Bureau also disaggregates at 60, 62, and 65 years of age because of Social Security eligibility rules.
Commuting time variables were the percentages of the population with average commutes to work of 0-4, 5-9, 10-14, 15-19, 20-24, 25-29, 30-34, 35-39, 40-44, 45-59, 60-89, and 90 or more min. The percentage of persons working at home was also used. Education variables were the percentages of persons whose highest attainment was through 8th grade, through 12th grade, general equivalency diploma (GED), some college, associate degree, bachelor degree, and graduate school. The income variables were median household, median family, and per capita incomes. Occupational variables were the percentage of workers in farming, protection, transportation, private household, material handling, professional, administrative, service, executive, precision manufacturing, technical, sales, and machinist occupations. We used these four variable categories—commuting, education, income, and occupation—because of conflicting evidence in the literature of the impact of economic status on membership trends. Our interest was not just in the broad aggregate categories, but was in the specific subdivisions listed above.
Political participation data were obtained from the Oklahoma State Election Board to measure the degree of political activity in each county. The percentages of the voting-age population registered as Democrats, Independents, or Republicans were used, as well as voter turnout data. We used the voter turnout data to compute the percentage of registered Democrats, Independents, and Republicans who actually voted, creating six total voting variables.
Religious data were obtained from the American Religious Data Archive (ARDA), which quantifies numbers of active members, estimated numbers of adherents, and number of churches. The ARDA is operated by the Department of Sociology at Pennsylvania State University and is based on participation surveys sent to a national sample of American Judeo-Christian churches.
Finally, percentages of the population residing in urban, suburban, rural non-farm, and rural farm locations were used. These variables were included to evaluate whether Masonry is a largely rural activity, as it is perceived to be both within and outside the organization.
The rationale for choosing several different versions of the same characteristic was our desire to find out which specific societal traits most strongly relate to Masonic membership. The Results and Discussion section demonstrates how we used this approach to pinpoint the nature of the relationship between Masonic membership and these social characteristics.
The variable under scrutiny was the percentage of the population who were Masons. We experimented with different measures of Masonic concentration, such as location quotients (20), but some of the statistical analyses described below required a standardized variable form such as a percentage. Furthermore, all of the independent variables except income were also measured in percentages, so this choice maintained a high level of consistency in the scaling of our variables, and the various forms of the dependent variable were highly correlated with one another anyway.
Correlation, Regression, and Cluster Analysis. Three basic statistical techniques were used in this study to approach the issue of Masonic membership from three different but related perspectives. Each method made a unique and useful contribution to this study.
Correlation analysis is the simplest technique, measuring the amount of covariance between two variables. If two variables trend in a very predictable fashion, the variables are strongly correlated and the Pearson's correlation coefficient r will have a value close to 1.0 for direct relationships or -1.0 for inverse relationships. Two variables that demonstrate no correlation will have a value of r near 0.0 (21).
Regression analysis assumes causation between variables. Independent variables are assigned as causative agents, and a dependent variable is observed to quantify
{Page 101}
the degree to which the independent variables explain the variation in the dependent variable. The coefficient r2 measures the strength of this relationship, ranging in value from 0.0 for no relationship to 1.0 for a perfect linear relationship, making r2 interpretable as a percentage (21). Generally, more than one independent variable would be expected to influence the dependent variable, so multiple regression is a more flexible tool in this type of analysis. The multiple regression coefficient R2 measures the strength of the relationship in essentially the same manner as does r2 (21).
Cluster analysis groups observations into logical clusters based on their similarity of values in multiple dimensions (22). Cluster analysis has numerous applications, but it is very pertinent to a geographic study such as this because of the human tendency to attempt to classify and group observations in some logical fashion; in this case, counties on the map. If members of the identified clusters are geographically contiguous, they will form natural regions that can be interpreted with respect to the cultural and socioeconomic context of the state.
| Introduction | Methods | Results and Discussion | Conclusions | References | Top of Page | Table of Contents | Home |
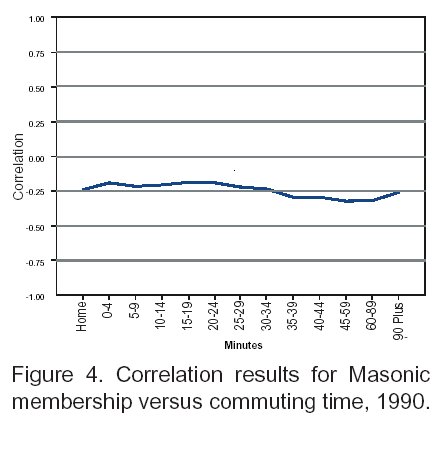
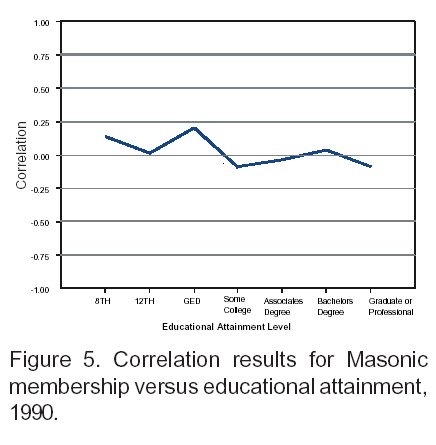
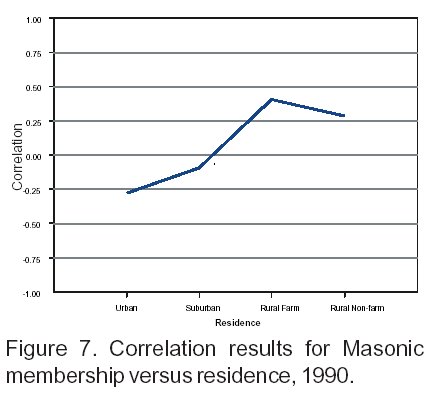
Correlation Analysis. Individual Pearson's correlation coefficients between each independent variable and the Masonic population percentage demonstrate that most of the expected relationships between socioeconomic characteristics and Masonic membership are valid. Figures 3 through 8 present summary graphs of the correlations by independent variable type. A scale of possible correlation coefficient values (r) is plotted on each vertical axis, and the various independent variable divisions are shown along the horizontal axes.
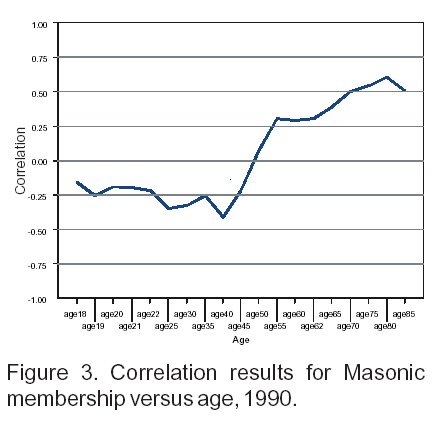
Age structure shows one of the clearest trends in the correlation analysis (Fig. 3). Age groups younger than 50 years showed negative correlations, indicating that on average, the younger a county, the lower its per capita membership levels. The over-50 age groups began having positive correlations, with the highest correlation occurring for the 80-84 year age group. Overall, the
{Page 102}
correlations consistently rose from the 40-44 year age group, which had the largest negative correlation, to the peak 80-84 year age group. Unfortunately for the Masons, this does not indicate that men simply do not start joining the group until they are in their 50s. Instead, this pattern demonstrates the remnants of the booming post-World War II decade in which men in their 20s and 30s became Masons and are now members of the oldest age divisions.
The importance of free time, and competing leisure opportunities, is revealed in Fig. 4. Although all correlations were negative between commuting time categories and membership, generally the trend was toward stronger negative correlations as commuting time increased until a slight rise for the 90 min and over category. Given the constant inverse relationship in this variable, even for persons who work at home (Home), it may be the case that commuting time is serving as a proxy for some other socioeconomic trait that is not conducive to Masonic membership, such as overall employment level.
The perception that Masons tend to be middle-class, blue-collar workers (5) and the disdain intellectuals have held for such organizations (7) shows up slightly in Fig. 5. The highest positive membership correlations were percentages with education only through 8th grade and with GEDs, while negative correlations existed with the categories of Some College and Graduate or Professional. Given the discrete nature of this variable and the unevenness of the correlation trend, however, we avoid strong inferences here.
Lacking an inherent ranking method for the occupation categories, we simply plotted them from highest positive correlation to highest negative correlation for convenience in Fig. 6. Percentages of workers in Farming correlated the highest with Masonic membership, and Protection, Transportation, and general Services were the only other positive correlations. Most of the occupations with negative correlations, including Professional, Executive, Administration, and various technical trades, are typically concentrated in urban and industrial areas. Hence, occupation may simply
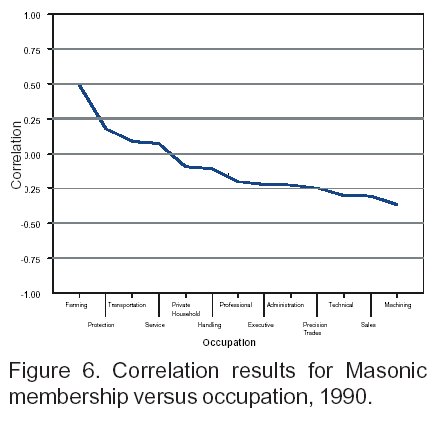
be serving as a proxy for urban/rural differences in the state.
Fig. 7 reinforces this idea because the Urban and Suburban variables had modest negative correlations with Masonic mem-
{Page 103}
bership. In contrast, both the Rural Farm and Rural Nonfarm categories correlated positively and were stronger. This result ties together numerous traits because rural areas are typically older, have fewer industries, and are dominated by agriculture. Furthermore, these are the types of areas in which Masonic activity is expected to remain strongest, which was verified by the high correlations of Masonic membership with ruralness, farming occupations, and older age categories.
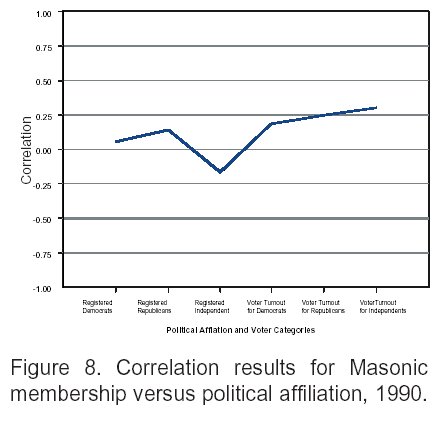
Fig. 8 reveals some confirmatory and contradictory evidence. First, correlations were higher for the Voter Turnout categories than the simple Registered voter categories. However, among registered voters, those registered as independents had the only negative correlation with Masonic membership, while among persons actually voting, independents had the highest positive correlation. One might infer that registered independents are merely apathetic to politics, whereas voting independents are quite civically active and thus prime candidates for Masonic membership. However, given the small overall correlations of the voter turnout variables (correlation coefficients between 0.20 and 0.30) and the small range between the lowest correlation and the highest (-0.15 to 0.30), such tendencies are probably weakly observable in society at large.
Finally, there were no notable or significant correlations among the income or religion variables, despite circumstantial and literary evidence to the contrary. Given the highly aggregated nature of the income data, this is not surprising. Furthermore, the income variables were measured in dollars, whereas all other independent variables were measured as percentages of the population, which may have had an impact on the analysis.
Regression Analysis. Regression analysis constructs a model of the predictor variables for Masonic membership. Ordinary least squares regression analysis quantifies the relationship between a dependent variable and independent variables that are expected to influence, or trend with, the dependent variable. Stepwise regression is a useful procedure in regression because it ranks independent variables based on the degree to which they significantly improve the model fit. Stepwise regression balances the desire to have the best possible model fit and highest explanatory power with the fewest number of variables. Thus stepwise regression only adds a variable to the regression model if it results in a significant increase in explanatory power.
An initial stepwise regression analysis using the independent variables listed in Table 1 produced the following equation for the best-fit hyper-plane:
y = 0.013 + 0.589(age80) - 0.190(ocmach)
-1.752(ocprihs)
Each coefficient indicates a slope parameter for the given independent variable and the sign indicates whether this is a positive or negative correlation. Predictably, the age 80-84 variable had the highest explanatory power and was selected first, producing an adjusted R2 value of 0.358. The machinist occupation was the second variable selected, raising R2 to 0.407. Finally, the private household occupation was the final significant predictor, raising the adjusted R2 to its final value of 0.442. These were the only three significant independent variables that trended with Masonic membership, and they only explained 44% of the total variation in membership levels. Although by itself the machinist occupation variable may not make sense, in conjunction with the urbanity of such an occupation, this variable seems to be measuring the negative effect of urbanity on Masonic membership. The private household occupation variable is difficult to interpret.
This model moderately violated the regression assumption of constant variance of error terms, and exploratory data analysis revealed that 16 of the 76 counties in Oklahoma were significant outliers in terms of their residuals (Fig. 9). We experimented further by removing these 16 counties to see if the model fit could be improved and to better meet the assumptions.
{Page 104}
The elimination of the 16 outlier counties produced a new model based on the remaining 60 counties and resulted in the following equation for a best-fit regression hyper-plane:
y = 0.008 + 0.773(age80) - 0.072(ed12)
Only the percentage age 80-84 and the percentage who graduated high school were significant; machinist and private household occupations dropped out. The final adjusted R2 value was 0.736, which was a notable improvement in explanatory power, and the assumption of constant variance was met with this reduced model. Thus, the strongest predictors of Masonic membership were the percentage of population aged 80-84, which had a strong positive relationship, and the percentage of the population that graduated from high school, which had a moderate negative relationship. Thus, although many of the potential explanatory variables did not produce significant results, the two that did are logical and expected.
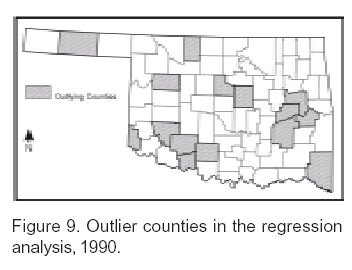
Out of curiosity, we constructed a regression model using only the 16 outlier counties, and it produced an R2 of 0.467 with rural farming population (rfarm) and the occupation of protection (ocprote) as the significant predictor variables, both with a positive relationship to Masonic membership. Evaluation of the assumptions for this mini-model revealed that Craig County remained a notable outlier. That Craig County has the lowest Masonic percentage of all 76 counties in the study may be the cause. The elimination of Craig County from the outlier mini-model, and the resultant regression analysis with 15 counties, produced an adjusted R2 of 0.766 and the retention of rural farm residence (rfarm) and protection occupations (ocprot) as the significant positive predictor variables. It is notable that of the 15 counties that comprised this mini-model of outliers, 12 of them have state parks, wildlife refuges, prisons, or military installations, employees of which all fall under the category of protection occupations.
Effectively, our regression analyses demonstrate several facets of Masonic membership in the state of Oklahoma. Despite the lack of physical contiguity, the state really consists of two areas: the 60 counties that make up the main model and whose Masonic membership is best predicted by age (positive) and education (negative), and the 15 counties that are largely dominated by activities that employ protection occupations and whose Masonic membership is best predicted by protection occupations (positive) and rural farm population (positive). Craig County defies classification and is an anomaly in either partition, and Cimarron County has no Masonic lodge and has been excluded from all analyses.
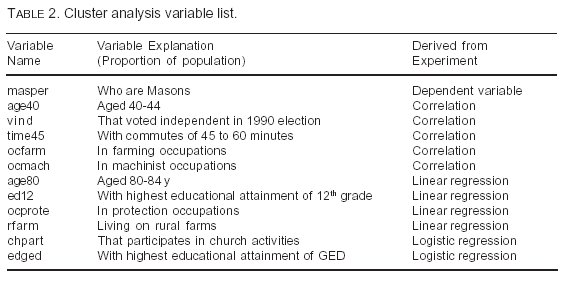
Cluster Analysis. The final method we employed was cluster analysis, which progressively aggregates observations based on their similarities via common variables. Instead of using the entire set of variables listed in Table 1, we reduced the data set to only those variables that turned up as significant in our previous analyses. Table 2 lists these variables.
These variables formed a 12-dimensional space within which cluster analysis uncovered similarities. Cluster analysis uses a twofold process in determining similarity. First, individual observations are evaluated based on the amount of similarity between them. The primary tool in this process is a ruler distance. Commonly, Euclidean, standardized, or Mahalanobis distances are used. Euclidean distance is the multi-dimensional extension of regular two-dimensional space, and requires all variables in the data to be in the
{Page 105}
same units of measure. We used the standardized distance, however, because it operates in the same fashion as Euclidean distance, except that it uses standardized z-scores and does not require measurements to be in the same units.
The second component in determining similarity is an algorithm that binds observations and subclusters into the final set of clusters. The process of accreting observations and subclusters is a linkage, and several methods of creating this linkage exist. We chose the Ward method because it tends to produce clusters with roughly the same number of observations, a technique similar to the data classification method of quantiles that is commonly employed in geographic mapping of socioeconomic data. It is also highly robust in dealing with outliers.
Ultimately, cluster analysis finds observations (counties) that are similar in the 12 dimensions; we then used correlation analysis to find out which variables correlated best with Masonic membership for each cluster. Each cluster, then, had a different significant variable set.
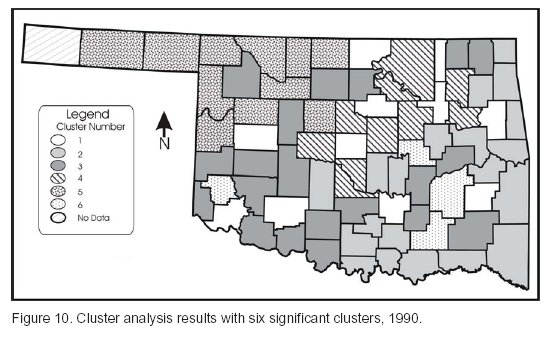
Cluster analysis produced results in which either five, six, or seven natural clusters formed in 12-dimensional space. Visual inspection of the counties that made up each cluster led us to conclude that the
{Page 106}
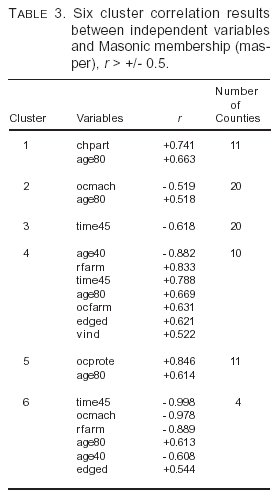
six-cluster model was the most logical and geographically sound (Fig. 10). Table 3 lists the independent variables that have correlations with Masonic percentage (masper) of at least 0.5 (positive or negative), indicating the strongest correlations within each cluster.
Cluster 1 showed strong relationships between older populations and higher church participation. Cluster 1 contains most of Oklahoma's largest cities, but otherwise is the least geographically contiguous of the five meaningful clusters that appeared.
Cluster 2 had strong correlations among older populations (positive) and machinist occupations (negative), indicating the proxy rural/urban factor. Geographically, this cluster dominates in southern and eastern Oklahoma, which are some of the more rural areas of the state.
Cluster 3 had only one variable, 45-59 min commutes, that correlated moderately (and negatively) with Masonic membership. Spatially, this cluster dominates southwestern Oklahoma, but includes scattered counties elsewhere. This inverse relationship between commuting time and membership implies that these areas lack significant industries, requiring longer commutes to larger cities and decreasing the leisure time for the population to participate in Masonry. However, even this one variable does not correlate well enough to warrant strong inferences.
Cluster 4 dominated the north central portion of the state and had the most correlations over 0.5. The population proportion aged 40-44 was the strongest correlation in this cluster and was negative, as expected. The other six strong correlations were all positive: rural farm residence, 45-59 min commutes, ages 80-84, farming occupations, highest educational attainment of a GED, and voting as an Independent.
Cluster 5 dominated in the northwestern area of the state including the panhandle, and had two significant correlations with Masonic membership: age group 80-84 and protection occupations, both positive correlations. This is an area of numerous state and federal parks, such as Black Kettle National Grasslands, Canton Lake, Salt Plains National Wildlife Refuge, and Little Sahara State Park. The game and park wardens employed in these areas account for the presence of the protection occupations.
Cluster 6 contained the remnant counties that did not fit with the other clusters, had the smallest number of observations (four), and lacked contiguity. This cluster had the second-most number of strong correlations, but the small number of counties precludes valid interpretation.
In summary, it appears that ruralness, protection occupations (usually in rural areas), and older populations strongly relate to higher Masonic membership levels, while urban-related occupations, such as machinists, and longer commuting times contribute to lower membership levels. These variables most strongly shaped the cluster analysis results. The spatial contiguity of four of the clusters, and
{Page 107}
the commonality of a fifth (Cluster 1, the urban counties), demonstrates distinctive socio-geographic regions of the state as they relate to Masonic membership in Oklahoma. These clusters provide some important starting points for recruitment and retention efforts by the Grand Lodge of Oklahoma.
| Introduction | Methods | Results and Discussion | Conclusions | References | Top of Page | Table of Contents | Home |
This article explored and documented aspects of the relationship between Masonic membership levels in Oklahoma and socioeconomic characteristics. We used geographic and statistical tools to study membership decline in the state. Although the topic of voluntary organizations has been well-studied by the field of sociology, analysis usually centers around survey information on why particular individuals no longer join such groups. We feel that a more aggregate, geographical, and census-based data approach complements this body of literature by looking for larger trends in how people behave based on their ages, incomes, education levels, occupations, residences, and political and religious factors. There are benefits and drawbacks to our approach. Our method produces large-scale generalizations and not predictions of the behavior of specific individuals, but it benefits from analyzing what people actually do (in terms of aggregate socioeconomic characteristics and membership totals) rather than relying on what they say they do on a survey.
Our analysis was based on a variety of socioeconomic variables to find correlations and relationships between population characteristics and Masonic membership levels for Oklahoma. The county level was the smallest level of detail for which we could obtain all the data we wished to analyze, but counties are logical subdivisions of the state and are well-suited to mapping. The county level served as a boundary for the lodges, in which we assumed that all of a lodge's members were residents of that same county. We did not feel that this assumption hurt our analysis, however, as cross-county lodge attendance was not expected to be that prevalent and no systematic differences between the migrants of one county and another were anticipated.
Overall, our results demonstrate that age is the most significant predictor of Masonic membership, specifically the proportions of the population who are in the retirement age categories (55 and over). Masons are generally elderly men, and few younger men are joining like was once the case. Masonry, like many other fraternal and service clubs, is losing out in popularity in the face of longer commutes, increasing competition for leisure time from sports and television, and the greater overall range of free-time activities available to urbanites as compared to rural communities. Along these lines, variables indicating rural living are the second most common variables that demonstrate significant explanatory power.
Educational levels correlate moderately to Masonic membership, but in an inverse trend in which more educated persons tend to avoid the group. This is a well-established trend that has been present for at least 100 y, if not longer. Certain occupations, in particular machinists, farmers, and protection services, correlate strongly, although these seem to behave more as proxies for urbanity and ruralness than as the impact of these specific occupations, given their modest contributions to the overall employment base of Oklahoma.
Political activities correlate modestly, and religious and income characteristics seem to have little relationship to Masonic membership at the county level despite some evidence in the literature. This may reflect the overall decline of popular interest in religion and politics in this country, even though hard data on whether churches or religion are truly in decline is often contradictory (2). It may also be the result of the degree of aggregation in the study, as county-level analysis tends to produce a lot of "noise" that makes it harder to find the "signal," the actual relationships that may appear between socioeconomic characteristics.
Finally, cluster analysis reveals a fairly
{Page 108}
clear pattern of regional differentiation in the predictor variables of Masonic membership. The western, southwestern, north-central, east-southeastern, and urban portions of the state formed logical clusters of counties for which different variables correlate more or less strongly to Masonic membership.
The results of this study in aggregate indicate what characteristics to look for in a county, if one wishes to identify a "model" county in which Masonic membership should be strong. This ideal county would have a large percentage of its population in retired age groups, more rural farming residents, short commutes, more occupational opportunities for protection and farming occupations, and a lower-than-average educational level. This description seems to accurately portray small-town America. Although this helps identify the counties that should and do have strong Masonic lodges and membership levels, this does not solve the systemic problem of how to attract younger members who will remain active for four or five decades. The typical older Mason today is such a person, but this cohort is dying and not being replaced by the baby boom and generation x cohorts that dominate the population today. Understanding where Masonry is strong or weak in the state is an important first step, but it falls to the Grand Lodge of Oklahoma, as well as other state lodges in the United States, to determine, first, whether it wants to change its target demographic, and then, second, how to go about effecting this change.
An important next step, one that we intend to pursue in the near future, is a reevaluation of this phenomenon with 2000 Census and membership data. In mid-2002, most variables had been released by the Census Bureau, but income and income-related variables were still not available for Oklahoma. Upon the release of these data, we intend to pursue this research further by evaluating how the relationships between socioeconomic variables and membership totals have changed between 1990 and 2000, as well as to continue monitoring the levels of Masonic membership in the state.
We would like to thank the Grand Lodge of Oklahoma for providing the membership information that formed the basis of this study, and Dr. Thomas A. Wikle and Dr. G. Allen Finchum for their insight on earlier versions of this research.
| Introduction | Methods | Results and Discussion | Conclusions | References | Top of Page | Table of Contents | Home |
1. Fost D. Farewell to the lodge. Am Demogr 1996;18(1):40-45.
2. Putnam RD. Bowling alone: the collapse and revival of American community. New York: Simon & Schuster; 2000. 54 p.
3. Schmidt AJ. Fraternal organizations. Westport (CN): Greenwood Press; 1980. 410 p.
4. Putney C. Service over secrecy: how lodge-style fraternalism yielded popularity to men's service clubs. J Pop Cult 1993;27(1):179-190.
5. Charles JA. Service clubs in American society: Rotary, Kiwanis, and Lions. Champaign: University of Illinois Press; 1993. 226 p.
6. Hausknecht M. The joiners: a sociological description of voluntary association membership in the United States. New York: The Bedminster Press; 1962. 141 p.
7. Wikle TA. Those benevolent boosters: spatial patterns of Kiwanis membership in the United States. J Cult Geog 1997;17(1):1-19.
8. Masonic Service Association of North America. Unpublished membership report. Silver Spring (MD): Masonic Service Association; 1999.
9. Grand Lodge of Oklahoma. Proceedings of the grand lodge of Oklahoma. 1999.
10. Wright CR, Hyman HH. Voluntary association memberships of American adults: evidence from national sample surveys. Am Soc Rev 1958;23(3):284-294.
11. Hodge RW, Treiman DJ. Social participation and social status. Am Soc Rev 1968;33(5):722-740.
12. Mueller CW, Johnson WT. Socio-
{Page 95}
economic status and religious participation. Am Soc Rev 1975;40(6): 785-800.
13. Oliver JE. The effects of metropolitan economic segregation on local civic participation. Am J Pol Sci 1999;43(1): 186-212.
14. Kaufman J. Three views of associationalism in 19th-century America: an empirical examination. Am J Soc 1999;104(5):1296-1345.
15. Secret PE, Johnson JB, Forrest A. The impact of religiosity on political participation and membership in voluntary associations among black and white Americans. J Black St 1990;21(1): 87-102.
16. Olsen ME. Social participation and voting turnout: a multivariate analysis. Am Soc Rev 1972;37(3):317-333.
17. Marden CF. Rotary and its brothers. Princeton (NJ): Princeton University Press; 1935. 178 p.
18. Wikle TA. Geographic patterns of membership in US environmental organizations. Prof Geog 1995;47(1):41-48.
19. Mazur A, Welch EW. The geography of American environmentalism. Environ Sci Policy 1999;2(4-5):389-396.
20. Isard W, Azis IJ, Drennan MP, Miller RE, Saltzman S, Thorbecke E. Methods of interregional and regional analysis. Brookfield (VT): Ashgate Publishing Company; 1998. 490 p.
21. McGrew JC, Monroe CB. An introduction to statistical problem solving in geography. Boston: McGraw Hill; 2000. 254 p.
22. Aldenderfer MS, Blashfield RK. Cluster analysis. Beverly Hills: Sage; 1984. 87 p.
Received: April 5, 2002; Accepted: July 1, 2002